By
Haskell V. Hart
May,
13, 2014
Copyright
© Haskell V. Hart. All rights reserved.
Duplication
of any part of this document is permitted for noncommercial use only. Republication may be permitted by expressed
written permission of the author if proper credit is given.
Abstract: The case of identifying a species from a
relatively short nuDNA sequence (<0.5% of genome) can be complicated by the conservation
of genes in related species. Unstructured or unrestricted database searches (e.g. BLAST™ from NCBI/NLM/NIH) will
typically yield a long hit list of relatively good matches to numerous related
species, genuses and even different families.
The problem is, “Which is the best
match, and what level of specification (family, genus, or species) is
justified.” We develop a methodology using
a case example of three purported “novel North American hominin” nuDNA
sequences. We employ database queries in
BLAST™, and introduce the concept of moments to identify the best matching
group (or taxon) among candidate groups with similar statistics in the hit
list. The methodology applies well to
wildlife forensics, anthropology, and criminalistics, and can be implemented
with an Internet connection and Microsoft® Excel.
Compared to nuDNA, species identification is
more often attempted with mtDNA, because the amount available in a cell is many
times more than the nuDNA, the whole genome is over 105 times smaller than the nuclear genome, allowing for
whole genome analysis in a short time, and because mtDNA is more hypervariable,
allowing for easier identification of specific individuals or populations. Barcoding with cytochrome-b[1] or
cytochrome-c oxidase I[2] genes is a particularly popular current method.[3] However, rapid advances in sequencing
technology are closing the gap between mtDNA and nuDNA in practical terms. For example, use of species specific primers
for STR (short tandem repeat) analysis at specific loci is also
popular.[4] Furthermore, in the case of
a new species, nuDNA sequencing, preferably of the whole genome, is required,
particularly if there is no holotype.
The publication of “Novel North American
Hominins: Next Generation Sequencing of Three Whole Genomes and Associated
Studies”[5], which contains an overview of the subject, by Melba Ketchum, et al., February, 2013, has prompted new
interest in the question of whether, in fact, such creatures, variously known
as bigfoot, sasquatch, yeti, abominable snowman, yowie (and other local names),
exist. To date no holotype specimen
(normally required for the recognition of a new species) has been
produced. However, based on the analysis
of DNA in this landmark publication, the authors claimed to have proven the
existence of such a hominin, for which the name, Homo sapiens cognatus, was granted at ZooBank, although such an
assignment does not confer recognition of existence.
Nuclear DNA sequences of three samples, 26,
31, and 140, were published by Ketchum, et
al.:
Sample 26 (S26) is a small piece of fur and
attached tissue from California. The
sequence contains 2,726,786 base pairs (bp). A second, independent
laboratory analysis with black bear and human primers, showed that it contained
black bear nuclear DNA and human and black bear mitochondrial DNA.[6] Nuclear DNA was not sequenced in that study.
Sample 31 (S31), from Alabama, came from a
paper plate in a food trap intended to capture DNA of the animal(s) attempting
to retrieve the food. No further details were given on the nature of the food
or the trap. The sequence contains
527,761 bp.
Sample 140 (S140) is blood from the inside
of a gutter downspout in Illinois which had holes in the pattern of teeth marks
and was torn from a house, requiring considerable force. The sequence contains
2,101,957 bp.
None
of these sequences is actually a “whole genome,” which would be over a thousand
times longer.
The relevant conclusions of Ketchum et al. were:
(1) “All known ape and
relic hominin species such as Neanderthal and Denisovan were excluded as being
contributors to both the nuclear and mitochondrial sequences.”
and the somewhat
contradictory,
(2) “Analysis of whole genome sequence and
analysis of preliminary phylogeny trees from the Sasquatch indicated that the
species possesses a novel mosaic pattern of nuclear DNA comprising novel
sequences that are related to primates interspersed with sequences that are
closely homologous to humans.”
and finally,
(3) “Nevertheless, the
data conclusively proves that the Sasquatch exist as an extant hominin and are
a direct maternal descendent of modern humans.”
Since no results of the database searches
which led Ketchum et al. to their
conclusions were published, this study was initially launched to validate their
remarkable claims concerning these three sequences. In the process of reinterpreting the original
sequences, it became clear that basic principles of nucleotide database
search-match were not previously followed.
Also, multiple different unpublished interpretations by others revealed
that a consistent methodology was not widely practiced, and not surprisingly,
inconsistent results were obtained.
Therefore we further focused the study on establishing a clearly defined
methodology in this area which would be useful to forensic scientists who may
not be experts in databases.
This paper is not about the “existence of sasquatch,” or the mtDNA results of
Ketchum et al.
COMPUTER
METHODS
We downloaded the published nuclear DNA
sequences of Samples 26, 31, and 140 in FASTA format from the Ketchum paper on
the DeNovo journal website.[3]
We conducted database searches on the
National Center for Biotechnology Information (NCBI) website (http://www.ncbi.nlm.nih.gov)
with the use of their BLAST™ (Basic Local Alignment Search Tool) software, as was
done in the Ketchum paper. The scope and
content of the databases, the BLAST™ software algorithms and parameters, and
the results output are well described on the NCBI website and in related
publications.[7, 8] We used the
following values of input parameters, except where noted.
- Optimize
for: Highly similar sequences (Megablast)
- Max
target sequences: 5000 used throughout (default 100)
- Expect
threshold: 10 (default)
- Word
Size: 28 (default), except when system required 64.
- Max
matches in a query range: 0 (unlimited by default)
- Match/Mismatch
Scores: 1,-2 (default)
- Gap
Costs: Linear (default)
- Filter:
Low complexity regions (default)
- Mask:
Mask for lookup table only (default)
We downloaded
tables of hits as Microsoft® Excel 2010 files for sorting and comparisons. Through the “Organism” field or the Boolean
logic language in the “Entrez Query” input field, we applied additional match criteria
to some searches, for example: all Ursidae
(bears) only. No additional or unusual
search techniques were employed. Only
standard options were employed, so the results can be easily duplicated.
It is worth noting here that even the most
recent comprehensive reference on wildlife DNA analysis[9] does not address
downloading the BLASTTM hit
list to Excel for further processing.
One is only taught how to read the BLAST™ summary of results, which we initially
found to be misleading in our study.
We employed a strategy which combines “step
back” and “drill down” searches for each sample. Specifically, we encompassed the broader
phylogeny (all other, AO) as well as limited searches to the most specific
family, genus, or species possible. In
this way, absolutely no potential match was missed, and the most possible
species details were discovered.
Another important strategy combined
comparisons of scores and %ID by sorting results first by one, then by
the other of these two critical evaluation parameters. The best match, represented by multiple hits,
appeared on top of both sorts.
We define first (m1ji)
of a single hit (i) within the j-th group (or taxon) with a

For the entire distribution
of hits in the j-th group (Nj
in number) the respective first and second moments,
M1j and M2j,
are defined by the averages:
with
and
defined in Equns. (1.1)
and (1.2), respectively. Note that
these are weighted (by score) average moments analogous to the moment of
inertia (a second moment) ≡
mass x (distance)2.
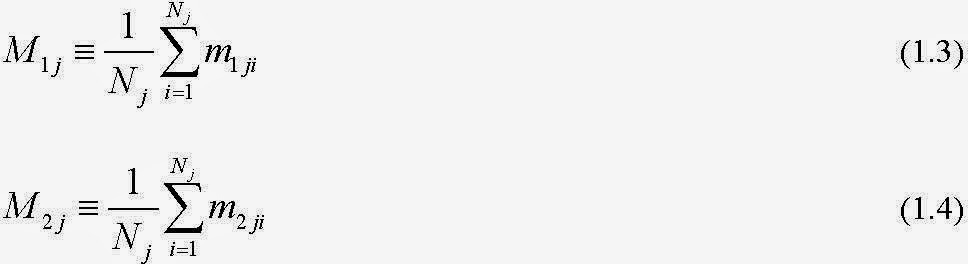
Calculation of group moments is simply a
matter of adding two more columns (M and N) to the downloaded BLAST™ hit list
in Excel and calculating the new cells as:
M1 = L1 *(C1-95) and N1 = L1*(C1-95)^2, etc., then summing the M and N
columns and dividing each by the number of hits (Nj)
to get the
M1j and M2j for each group (j) (Equns.
1.3 and 1.4, respectively). Group (j)
moments are easiest to calculate for hit lists from searches limited to
specific groups (j). Otherwise, the hit
list must be hand sorted by group, using the accession numbers, which must be individually
looked up, which is not practical.
Computed for all candidate groups, {M1j, M2j} reduce long lists of hits across the unknown sequence to
two numbers for each candidate group, which can be compared across the groups. We found that ordering groups by {M2j}
was more discriminating than by {M1j},
,
correspond to the group
(k) with the best overall match to the entire DNA sequence.
Average overall group (j) %ID, Pj,av
is calculated by:

where Lji = sequence length (bp) of the i-th match (hit) in the j-th group.
Overall coverage of hits as a percentage of query
sequence was calculated by first removing the duplicates and adjusting Qstartji
overlaps,
then sorting by Qstart and then by Qend (“Start” and “End” in the following
tables) of the hits. Gaps between hits
were identified and summed. The
coverage, %Cj,
for the j-th group, was calculated by:

where L is the query sequence length in bp,
and the summation is over all hits with
numerically ordered unique Qstartji
to Qendji
hit ranges. The result is Nj
the overall % coverage for the group j. BLAST™ summary pages now list the % coverage for
the hit with highest score for each database entry (until recently it was the total
coverage of all hits on a database entry), but these data are not in the
downloaded Excel hit list file, so they cannot be readily summed by group.
We list valuable principles of this type of
database search and resulting comparisons in the DISCUSSION section.
RESULTS
Sample 26
To start with, we queried the S26 sequence
against the Nucleotide Database with BLAST™, producing a bewildering hit list
of many different mammals. A wrong conclusion at this point would be
that it must be a new species, since it doesn’t match any existing species
solely. Retrospectively we discovered
that adding the first and second moment columns to the hit list (in Excel) and
sorting by second moment (Equn. 1.2), then first moment (Equn. 1.1), results in
five of the top six hits being the giant panda (Ailuropoda melanoleuca).
These entries rose from 129-th, 199-th, 247-th, 707-th, and 888-th
places in the hit list sorted by score.
Another wrong conclusion at
this point would be that since pandas are not extant to California, there must
be something wrong with the query sequence, e.g. contamination or sequencing
errors. Next, we ran the entire S26
sequence against the Human Genome + Transcription (G + T) Database. The
top 21 hits were all on human Chromosome 11.
“Query cover” was as high as 15% of S26 on one database entry
(representing numerous individual hits).
“Total score” was as high as 6.756 x 10⁵ for one entry. “Max. ident.” (maximum % identity) was 100%
for each of the top 21 hits. This table,
by itself, gives the false impression that S26 is human or human-like (another wrong conclusion). However, “Max score” does not necessarily
correspond to the same sequence range as “Max. ident.” (maximum %ID), which may
be for a very short sequence. Furthermore,
“Total score,” though an impressive, large number, may be the sum of many short
(and possibly unimportant) sequences and/or relatively low %ID hits. Finally, the “E value” (the probability of a
random match) is always low for any significant sequence length, N, because
(1/4)N will be very small,
often below the numerical limit of the computer (10-179),
represented by a zero in BLAST™ output.
In summary, the BLAST™ summary results page cannot be taken as the sole
ultimate proof of identity; it is only a starting point.
Near the end of this study, NCBI changed the
“Max. ident.” field to “Ident.”, now defined as the %ID of the sequence segment
with the “Max. score.“ This is a much
more useful number. Also “Query cover”
now refers only to the sequence range of the “Max. score.” This is not a useful number in this study, 0%
rounded off for all the relevant hits for long query sequences with relatively
short sequence matches. A rerun of the
above S26 vs. human G + T yielded output with the 21 hits/matches with the
highest scores averaging only 94%ID. Usually >99%ID is required for a
species match.
Table 1 compares the top 15 human hits by score and the top 15 Ursidae (bear family) hits to other primates (OP), the genus Canis (dogs, wolves, coyotes), and all other (AO) species not previously included. Here Ursidae were the best match over 15 of the total 17 sequence ranges. The dog is also a better match than human in most cases. Other primates show results more like humans than dogs or bears. There were no black bear matches over any of the sequence ranges in Table 1.
|
Table 1. S26 top 15 human hits and top 15 Ursidae hits by score.
| |||||||||
|
S26 vs.
|
Match(a)
|
% ID
|
LEN
|
MIS
|
GAP
|
Start(b)
|
End(c)
|
SCORE
| |
|
human-N(1)(d)
|
BC038508.1
|
93.32
|
2142
|
114
|
13
|
189026
|
191141
|
3136
| |
|
OP(f)-N:
chimpanzee
|
XM_003951836.1
|
93.18
|
2142
|
117
|
10
|
189026
|
191141
|
3120
| |
|
Canis-N: dog
|
NM_001097982.2
|
95.36
|
2089
|
72
|
7
|
189026
|
191089
|
3297
| |
|
polar bear(1)-TSA
|
GAJD01008005.1
|
98.69
|
2134
|
0
|
12
|
189028
|
191136
|
3760
| |
|
AO(g)-N:
Pacific walrus(h)
|
XM_004394587.1
|
96.58
|
2136
|
45
|
12
|
189026
|
191136
|
3515
| |
|
human-N(2)
|
NG_012881.1
|
95.85
|
1495
|
33
|
14
|
362696
|
364161
|
2390
| |
|
OP-RS: orangutan
|
NC_012602.1
|
95.52
|
1497
|
35
|
15
|
362696
|
364161
|
2364
| |
|
dog-RS
|
NC_006603.3
|
composite
|
10
|
10
|
362697
|
364161
|
~2595
| ||
|
giant panda-RS(4)
|
NW_003217713.1
|
97.32
|
1494
|
9
|
5
|
362698
|
364161
|
2508
| |
|
AO-N: mouse
|
AC158579.7
|
92.91
|
1100
|
43
|
17
|
363059
|
364130
|
1567
| |
|
human-N(3)
|
NM_001039618.2
|
92.27
|
1695
|
73
|
34
|
1655921
|
1657569
|
2351
| |
|
OP-N: n. white-cheeked
gibbon
|
XM_003254601.2
|
92.96
|
1690
|
73
|
24
|
1655921
|
1657569
|
2420
| |
|
dog-RS
|
NC_006603.3
|
94.89
|
1682
|
35
|
21
|
1655921
|
1657569
|
2582
| |
|
giant panda-RS(2)
|
NW_003217478.1
|
96.45
|
1688
|
7
|
13
|
1655920
|
1657569
|
2736
| |
|
AO-N: cattle
|
BC142239.1
|
92.60
|
1555
|
57
|
31
|
1655921
|
1657446
|
2182
| |
|
human-N(4)
|
Z83001.1
|
98.71
|
1239
|
15
|
1
|
690618
|
691855
|
2198
| |
|
OP-RS: chimpanzee
|
NC_006478.3
|
98.79
|
1239
|
14
|
1
|
690618
|
691855
|
2204
| |
|
Canis-N: dog
|
AC203200.2
|
99.03
|
1238
|
11
|
1
|
690618
|
691854
|
2218
| |
|
giant panda-RS(10)
|
NW_003217489.1
|
99.35
|
1237
|
8
|
0
|
690618
|
691854
|
2241
| |
|
AO-N: pig
|
CU462945.6
|
98.45
|
1229
|
17
|
2
|
690624
|
691851
|
2163
| |
|
human-G+T(5)
|
NT_009237.18
|
93.90
|
1460
|
67
|
19
|
312074
|
313518
|
2183
| |
|
OP-N: gorilla
|
XM_004050754.1
|
94.44
|
1403
|
63
|
14
|
312127
|
313518
|
2145
| |
|
dog-RS
|
NC_006603.3
|
94.18
|
1444
|
40
|
13
|
312098
|
313519
|
2161
| |
|
giant panda-RS(3)
|
NW_003217713.1
|
98.00
|
1453
|
18
|
6
|
312074
|
313519
|
2512
| |
|
AO-N: Florida manatee
|
XM_004369676.1
|
92.18
|
1420
|
73
|
25
|
312127
|
313522
|
1973
| |
|
human-N(7)
|
NM_001278163.1
|
94.76
|
1354
|
35
|
15
|
759948
|
761288
|
2074
| |
|
OP-N: n. white-cheeked
gibbon
|
XM_003254384.2
|
95.20
|
1353
|
34
|
12
|
759948
|
761288
|
2109
| |
|
dog-RS
|
NC_006600.3
|
97.55
|
1349
|
20
|
5
|
759948
|
761288
|
2296
| |
|
polar bear-N(6)-TSA
|
GAJD01025080.1
|
98.60
|
1359
|
1
|
5
|
759948
|
761288
|
2388
| |
|
AO-N: Pacific walrus
|
XM_004406102.1
|
97.94
|
1357
|
12
|
6
|
759948
|
761288
|
2337
| |
|
human-G+T(6)
|
NW_004078072.1
|
92.53
|
1459
|
94
|
7
|
1761457
|
1762900
|
2076
| |
|
OP-N: chimpanzee
|
XM_001136982.3
|
92.53
|
1459
|
94
|
7
|
1761457
|
1762900
|
2076
| |
|
Canis-N: dog
|
XM_843414.2
|
94.65
|
1459
|
63
|
6
|
1761457
|
1762900
|
2248
| |
|
Ursidae-N(5): giant panda
|
XM_002920733.1
|
97.67
|
1460
|
19
|
4
|
1761456
|
1762900
|
2494
| |
|
AO-N: Pacific walrus
|
XM_004410744.1
|
95.27
|
1459
|
54
|
4
|
1761457
|
1762900
|
2298
| |
|
human-N(8)
|
NM_001039618.2
|
93.39
|
1376
|
54
|
15
|
1657663
|
1659004
|
2002
| |
|
OP-N: small-eared
galago
|
XM_003780852.1
|
94.43
|
1364
|
48
|
10
|
1657662
|
1659004
|
2073
| |
|
dog-RS
|
NC_006603.3
|
composite
|
1657662
|
1659004
|
~2336
| ||||
|
giant panda-RS(7)
|
XR_097023.1
|
incomplete composite
|
1657663
|
1658930
|
~2312
| ||||
|
AO-N: star-nosed mole
|
XM_004683259.1
|
93.51
|
1371
|
47
|
17
|
1657663
|
1659004
|
2001
| |
|
human-N(9)
|
NG_012881.1
|
94.27
|
1308
|
63
|
6
|
326857
|
328153
|
1989
| |
|
OP-RS: gorilla
|
NC_018435.1
|
94.11
|
1308
|
65
|
4
|
326857
|
328153
|
1978
| |
|
dog-RS
|
NC_006603.3
|
97.38
|
1300
|
29
|
4
|
326857
|
328153
|
2207
| |
|
giant panda-RS(8)
|
NW_003217713.1
|
98.69
|
1300
|
13
|
3
|
326857
|
328153
|
2303
| |
|
AO-N: mouse
|
AC107371.17
|
84.86
|
1268
|
148
|
25
|
326867
|
328112
|
1238
| |
|
human-N(10)
|
AC080100.7
|
95.03
|
1268
|
48
|
8
|
855386
|
856643
|
1978
| |
|
OP-N: n. white-cheeked
gibbon
|
XM_003254447.2
|
95.39
|
1064
|
43
|
3
|
855581
|
856643
|
1688
| |
|
dog-RS
|
NC_006600.3
|
96.37
|
1267
|
30
|
7
|
855387
|
856643
|
2071
| |
|
polar bear-TSA(9):
|
GAJD01033484.1
|
99.05
|
1267
|
2
|
5
|
855387
|
856643
|
2265
| |
|
AO-N: Pacific walrus
|
XM_004404764.1
|
97.71
|
1265
|
18
|
6
|
855387
|
856643
|
2165
| |
|
human-N(11)
|
AC093262.2
|
98.03
|
1117
|
19
|
2
|
673215
|
674328
|
1938
| |
|
OP-RS: crab-eating
macaque
|
NC_022285.1
|
98.21
|
1118
|
15
|
2
|
673215
|
674327
|
1949
| |
|
dog-RS
|
NC_006600.3
|
99.1
|
1114
|
10
|
0
|
673215
|
674328
|
2002
| |
|
Ursidae-TSA(15): giant panda
|
NW_003217489.1
|
99.28
|
1114
|
5
|
1
|
673215
|
674328
|
2010
| |
|
AO-N: pig
|
CU468610.6
|
98.57
|
1115
|
10
|
4
|
673218
|
674328
|
1965
| |
|
human-N(12)
|
NG_027813.1
|
96.28
|
1156
|
42
|
1
|
2258575
|
2259729
|
1895
| |
|
OP-N: pygmy chimpanzee
|
DQ977225.1
|
96.37
|
1156
|
41
|
1
|
2258575
|
2259729
|
1901
| |
|
Canis-N: dog
|
XM_536554.3
|
95.30
|
1149
|
54
|
0
|
2258573
|
2259721
|
1823
| |
|
Ursidae-N(13):giant
panda
|
XM_002927883.1
|
99.65
|
1149
|
4
|
0
|
2258573
|
2259721
|
2100
| |
|
AO-N: Pacific walrus
|
XM_004412631.1
|
98.95
|
1147
|
12
|
0
|
2258575
|
2259721
|
2052
| |
|
human-N(13)
|
AL122015.17
|
96.75
|
1109
|
36
|
0
|
756650
|
757758
|
1849
| |
|
OP-N: n. white-cheeked
gibbon
|
XM_003254385.2
|
96.74
|
1104
|
35
|
1
|
756646
|
757748
|
1838
| |
|
dog-RS
|
NC_006600.3
|
97.66
|
1109
|
26
|
0
|
756650
|
757758
|
1905
| |
|
giant panda-RS
|
NW_003217489.1
|
98.20
|
1110
|
17
|
1
|
756650
|
757759
|
1936
| |
|
AO-N: Pacific walrus
|
XM_004406102.1
|
98.91
|
1099
|
12
|
0
|
756650
|
757748
|
1964
| |
|
human-N(14)
|
NG_012881.1
|
95.22
|
1172
|
30
|
11
|
359243
|
360388
|
1831
| |
|
OP-RS: small-eared
galago
|
NW_003852396.1
|
95.4
|
1173
|
27
|
3
|
359243
|
360388
|
1842
| |
|
dog-RS
|
NC_006603.3
|
97.44
|
1171
|
5
|
1
|
359243
|
360388
|
1973
| |
|
giant panda-RS
|
NW_003217713.1
|
97.78
|
1171
|
1
|
1
|
359243
|
360388
|
1995
| |
|
AO-N: mouse
|
AC158579.7
|
90.81
|
1175
|
73
|
16
|
359243
|
360388
|
1539
| |
|
human-N(15)
|
NM_002233.3
|
94.77
|
1185
|
45
|
12
|
602053
|
603228
|
1829
| |
|
OP-N: olive baboon
|
XM_003910099.1
|
95.27
|
1185
|
45
|
8
|
602053
|
603228
|
1868
| |
|
Canis-N: dog
|
XM_542545.2
|
93.07
|
895
|
56
|
4
|
602341
|
603229
|
1304
| |
|
giant panda-RS(12)
|
NW_003218343.1
|
98.99
|
1184
|
3
|
2
|
602054
|
603228
|
2111
| |
|
AO-N: Pacific walrus
|
XM_004412889.1
|
97.30
|
1183
|
23
|
3
|
602055
|
603228
|
1999
| |
|
human-G+T
|
NW_004078072.1
|
93.87
|
1175
|
65
|
5
|
1835440
|
1836608
|
1764
| |
|
OP-N: gorilla
|
XM_004052006.1
|
93.79
|
1175
|
66
|
5
|
1835440
|
1836608
|
1759
| |
|
Canis-N: dog
|
XM_533970.3
|
92.99
|
1155
|
76
|
4
|
1835459
|
1836608
|
1679
| |
|
polar bear-TSA(11)
|
GAJD01015683.1
|
99.23
|
1174
|
4
|
3
|
1835440
|
1836608
|
2113
| |
|
AO-N: Pacific walrus
|
XM_004398087.1
|
97.36
|
1174
|
26
|
3
|
1835440
|
1836608
|
1991
| |
|
human-N
|
AP000609.5
|
93.29
|
1147
|
62
|
7
|
1508092
|
1509231
|
1677
| |
|
OP-N: chimpanzee
|
XM_003808137.1
|
93.29
|
1147
|
60
|
9
|
1508090
|
1509231
|
1676
| |
|
dog-RS
|
NC_006603.3
|
95.45
|
1144
|
30
|
8
|
1508103
|
1509231
|
1805
| |
|
polar bear-TSA(14)
|
GAJD01035976.1
|
98.96
|
1151
|
0
|
2
|
1508093
|
1509231
|
2049
| |
|
AO-N: domestic ferret
|
XM_004795929.1
|
96.04
|
1161
|
16
|
11
|
1508093
|
1509231
|
1862
| |
Table
1. Hits
are grouped by matching sequence ranges of the top 15 hits by score and
separated by blank rows. (a) NCBI accession number. (b)
First position of matching query (S26) sequence range. (c) Final position of matching
query (S26) sequence range. (d) "N"
indicates Nucleotide Database. Relative
score (1-15) in parentheses. (e) "G + T" indicates human
Genomic plus Transcription Database. "TSA" indicates Transcriptome
Shotgun Assembly Database. "RS"
indicates Reference Genomic Sequence Database.
(f) OP = Other
Primates (ex Homo sapiens).
(g) AO = All Other (ex primates, ex Canis, ex Ursidae). (h) Common species names for
each match after colon. Same format and
abbreviations followed in Tables 4 and 5.
A summary of Table 1 results is presented in Table 2. Clearly Ursidae, represented here by the panda (Ailuropoda melanoleuca) and the polar bear (Ursus maritimus), are the best overall match by all four criteria: number of best scores, average rank, average score, and average %ID, over the top 15 human and top 15 Ursidae hits by score.
CONTINUED
A summary of Table 1 results is presented in Table 2. Clearly Ursidae, represented here by the panda (Ailuropoda melanoleuca) and the polar bear (Ursus maritimus), are the best overall match by all four criteria: number of best scores, average rank, average score, and average %ID, over the top 15 human and top 15 Ursidae hits by score.
|
Table 2. Comparison of
hits by groups: summaries of Tables 1, 4, and 5.
| |||||
|
Group
|
Best Scores(a)
|
Average Rank(b)
|
Std. Dev.(c)
|
Ave. Score
|
Ave. %ID(d)
|
|
| |||||
|
S26 Top Hits from Table 1.
| |||||
|
Ursidae
|
15
|
1.1
|
0.3
|
2325
|
98.4
|
|
Canis (dog)
|
1
|
2.9
|
1.2
|
2146
|
96.0
|
|
All Other
|
1
|
3.2
|
1.6
|
1930
|
95.2
|
|
Other Primates
|
0
|
3.9
|
0.9
|
2075
|
94.9
|
|
Human
|
0
|
3.9
|
0.8
|
2068
|
94.7
|
|
S31 Top Hits from Table 4(e)
| |||||
|
Human (15) (f)
|
13.5
|
1.1
|
0.21
|
373.4
|
99.8
|
|
Other Primates(15)
|
1.5
|
1.9
|
0.21
|
360.3
|
98.7
|
|
Canis (dog) (2)
|
0
|
3.6
|
0.28
|
278.5
|
97.5
|
|
All Other (6)
|
0
|
3.4
|
0.28
|
176.0
|
87.2
|
|
S140 Top Hits from Table 5
| |||||
|
Canis (dog)
|
17
|
1.0
|
0.0
|
1848
|
98.5
|
|
All Other
|
0
|
2.4
|
0.8
|
1689
|
95.3
|
|
Other Primates
|
0
|
3.0
|
0.5
|
1608
|
94.4
|
|
Human
|
0
|
3.6
|
0.6
|
1603
|
94.3
|
Table 2. (a) Number of best scores. (b) Groups were ranked by score
(1 highest, 5 lowest) in each hit sequence
range. (c) Of Average Rank. "N-1" formula
used. (d) Equn. 1.5. (e) Fungus and bacteria hits removed. (f) Number of hits in parentheses. All ties were averaged, e.g. tie for first is
0.5 for each best score and 1.5 for each hit rank.
CONTINUED
No comments:
Post a Comment