Ketchum et al. (2013) exhibited as their Fig. 5 hair photomicrographs of Sample 26 (the Smeja find) and a human hair comparison. They claimed that: “Most of the submitted hairs were not microscopically consistent with any of the hairs from the reference collection of common animal hairs that included human, cat, dog, cow, horse, deer, elk, antelope, moose, sheep, fox, bear, coyote, wolf, rat, mouse, monkey, beaver, squirrel, llama and others.” (emphasis mine), and that Figs. 5B Left and 5C Right are from a sasquatch. The hair analyst was David W. Spence of Southwest Institute of Forensic Sciences in Dallas, Texas.
In view of the controversy around this study, especially Sample 26, which was independently analyzed as black bear by three additional laboratories, these photomicrographs should have been more carefully examined long ago. “Better late than never.”
Identification of hairs by microscopy can be subjective, because there is variation among individuals and even among different hairs from a single individual, such that forensic determination in some criminal cases has been challenged and overturned. Never the less, it remains a good screening tool, and in many cases it is definitive for identifying or classifying wildlife, especially when the number of possibilities is small.
We are fortunate that, in the case of Ketchum et al. Sample 26, we are only called upon to judge whether the hair in their Fig. 5 is from a primate or a bear, which have very different hair morphologies. With a small amount of image enhancement (limited to brightness, contrast, and sometimes also color), this call is very obvious. Enhancements of this sort can be made at the microscope level before photographing with included software or later with Photo Shop or other image software such as that included with Microsoft Word®. We used all three approaches here. Understand that these enhancements are not the same as the attempts to bring out of focus pictures into clarity as is done by Scott Carpenter with Blurity!. Blurity! is for motion blurring, not out of focus blurring. All of the photomicrographs in Figs. 1-13 are in focus pictures, some of which were initially just too dark to resolve details before enhancement
Fig. 1 is from the Ketchum et al. (2013) paper, their Figure 5B Left, and purports to show a Sample 26 sasquatch hair. Fig. 2 is basically the same photograph, extended in length from p. 109 of Carpenter (2019), who supports her interpretation. Both figures have been enhanced in brightness and contrast here. By comparison to Figs. 3-7 it is very clear that the Ketchum et al. (2013) Fig. 5B Left photomicrograph matches black bear extremely well. Shared characteristics are: continuous, nodose, corpuscular medulla of disc shaped cells, and Medullary Index (MI) of 0.25-0.50 for guard hairs. Medullary Index = Diameter of medulla / Diameter of shaft. Underfur in reference Figs. 5 and 7, exhibit lower MI and single ladders of the same corpuscular disc shaped cells.
In contrast, primate hairs usually show discontinuous, thinner medulla (MI < 0.2, often much less) or no medulla as shown in Figs. 8 for human, 10 for orangutan, and 11 for gorilla. Fig. 9 for chimpanzee shows a more continuous thicker medulla, but because of the intense pigmentation, the real width of the medulla is somewhat uncertain. For such samples the microscopist must increase the light intensity in transmission or go to dark field or crossed polarizers, which was not done in Fig. 9. Crossed polarizers bring out different birefringent colors for otherwise indistinguishable features. (See Fig. 10 for gorilla).
Cuticle comparisons are also insightful. Fig. 12. is from the Ketchum S26 (Fig. 5C Right). Fig. 13 is a black bear cuticle. These are extremely similar, in fact, they are indistinguishable in the context of species identification.
In summary, it is hard to imagine why Mr. David Spence did not recognize the unmistakable features of bear hair for Sample 26. But then, it’s just one of many red flags that Ketchum et al. did not recognize in their quest to prove their hypothesis.
Note: All photomicrographs are for research and education only, "Fair Use."
Note: All photomicrographs are for research and education only, "Fair Use."

Fig. 1. "Sasquatch" Ketchum et al. (2013). Fig. 5B (Left) Contrast and brightness adjusted.


Fig.3 Black bear. Hart private collection.

Fig. 4. Black bear. Hart private collection.

Fig. 5. Bear underfur. Deedrick (2004).

Fig. 6 Black bear guard hair. Alaska Fur ID Project. Contrast, brightness, and color adjusted.

Fig. 7. Black bear underfur. Alaska Fur ID Project.

Fig. 8. Human. Public Domain. Variety of medulla: none, discontinuous, nearly continuous.


Fig. 9. Chimpanzee. Chris Murphy. Left original. Right brightness, contrast, and color enhanced.
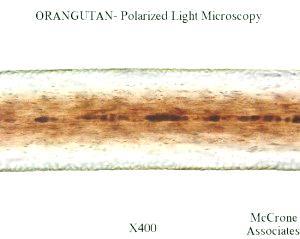
Fig. 10. Orangutan. McCrone Associates. Brightness and contrast adjusted. Arrow points to thin medulla.

Fig. 11. Gorilla. Crossed polarizers. McCrone Associates. Brightness and contrast adjusted. Red arrows point to thin medulla (yellow).

Fig. 12. "Sasquatch." Ketchum et al. (2013) Sample 26. Fig. 5 C Right, cuticle.

Fig. 13. Black bear cuticle. Hart private collection.
References
Alaska Fur ID Project. https://alaskafurid.wordpress.com/
Carpenter S. (2019) Truth Denied: The Sasquatch DNA Study. Self-Published.
Deedrick D. W. (2004) Microscopy of Hair Part II: A Practical Guide and Manual for Animal Hairs. Forensic Science Communications. July 2004 - Volume 6 - Number 3.
https://archives.fbi.gov/archives/about-us/lab/forensic-science-communications/fsc/july2004/research/2004_03_research02.htm
https://archives.fbi.gov/archives/about-us/lab/forensic-science-communications/fsc/july2004/research/2004_03_research02.htm
Ketchum M. S. et al. (2013) Novel North American hominins: next generation sequencing of three whole genomes and associated studies. DeNovo 1:1.


